What is Perceived Information?
In our quest to understand perceived information, we aim to minimize mathematical formulae and maximize the pleasure of interactive learning. I recommend the original paper for those who prefer a formal explanation (see notes at the end of this tutorial). Let us begin with basic identity information:
Species: Information theoretic metric for resilience to side-channel attack.
Date of birth: 2011
Origin: EUROCRYPT
Creators: M. Renauld, FX. Standaert, N. Veyrat-Charvillon, D. Kamel, D. Flandre
In side-channel analysis, mutual information was introduced to measure the resilience of a cryptographic implementation to side-channel attacks. It has two interesting properties: first, it is independent of the adversary capabilities, and second, it has the same meaning regardless of the implementation or the used countermeasures. Sounds good, right? Unfortunately, there is a problem.
To calculate mutual information, we need the true probability density of the leakage generated by the chip where the algorithm is being executed. Still, nobody knows it, not even the chip manufacturer. The best we have is an estimated probability density. But wait.. what does this probability density represent? Good question.. we need to clarify this before going further.
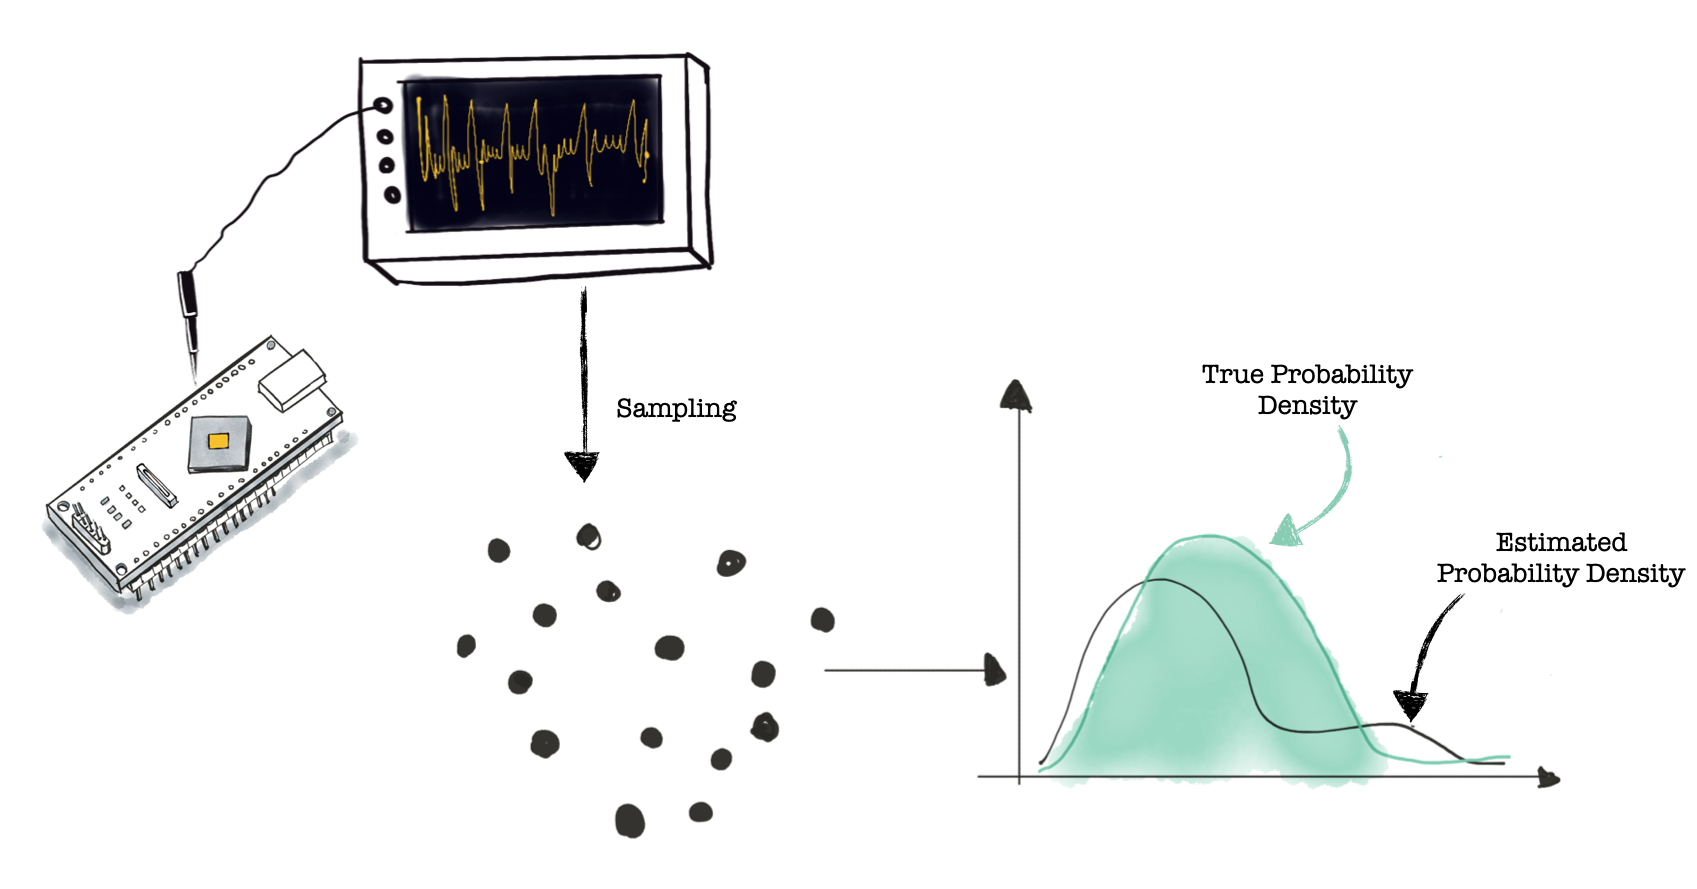
As illustrated in the figure below, we measure side-channel traces (power/EM) with an oscilloscope from a target chip and record the execution of the crypto algorithm for different inputs. For this example, the crypto algorithm uses a fixed key. Each time sample in our power trace represents the power consumed at a given time moment while, for example, processing an instruction. Let’s call this our target. By sampling (at the same time instance), we obtain different values for the power consumption of our target. The estimated probability density describes the power consumption of our target for a given key. The black dots in the figure below represent the different values we collected for our target in the figure, and the estimated probability density is represented by the black line. There is a difference between the true and estimated probability density due to estimation or measuring errors.
We said that we can use mutual information to measure the resilience of a crypto implementation. Mutual information is a function of two variables that returns the amount of information the two variables have in common. In our case, we are interested in $I(L;K)$ where $K$ is the random variable describing the key and $L$ is the random variable representing the leakage. The illustration below shows the computation of mutual information for side-channel analysis. The distribution of $K$ is (hopefully) uniform and known.
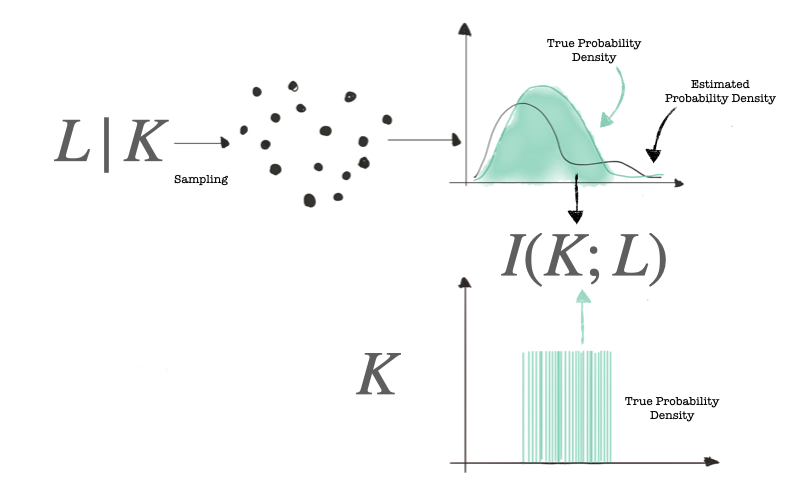
The savvy reader has realized that mutual information is defined as: $I(K;L)=H(K)-H(K|L)$, and we do not have variable $K|L$. Luckily this problem was solved, and you can see how to derive the formula of mutual information in this interactive notebook.
So what is the problem?
Somewhat surprisingly, estimating mutual information is a challenging problem. I don’t mean hard because we don’t know how to use a histogram estimator (or… for a more sophisticated touch, use a kernel estimator); hard means there are no known unbiased estimators for mutual information convergence depends on the probability density. This means that we will always have errors when estimating mutual information.
Additionally, we know that chips manufactured in the same batch have slight variations due to process variations. This means that even if we would have an exact estimator, the leakage probability of different chips will be different. The worst-case scenario (for the chip) is when the adversary can profile and attack the same chip, but in a more realistic setting, the adversary will have access to one chip to profile and attack a different chip.
Enough! Can you finally tell me what perceived information is?
Ok, ok.. perceived information is a lower bound on mutual information. It gives us the amount of information extracted from a leaking device thanks to an estimated statistical model. Said statistic model is possibly degraded due to estimation errors and assumption errors (we assume the target has one distribution, but in reality, it has a different one). A lower bound is not really useful unless we have an upper bound. Luckily, in 2019, hypothetical information, an upper bound for mutual information, was introduced. It gives the amount of information that can be extracted from a leaking device in the worst case.
The figure below shows with blue dots, the samples we want to attack/profile, are shown with. The estimated probability density for the variable $L|K$ is used to calculate the hypothetical information (to a careful observer who has opened this interactive notebook its formula looks identical to that of mutual information).
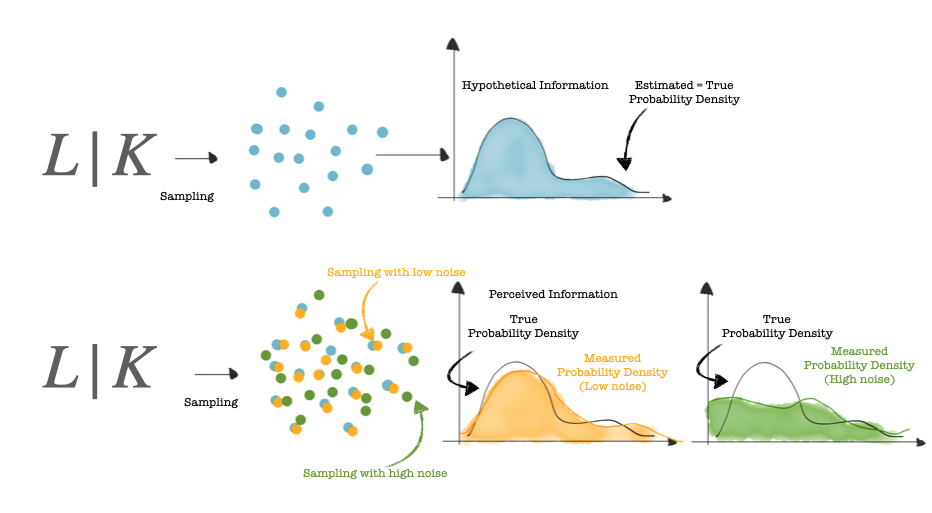
Let us observe in the figure above that when the blue dots are disturbed by slight noise, we obtain the orange dots. The measured probability density (orange) is slightly different to the true probability density (black). However, when the blue dots are disturbed by significant noise, and we obtain the green dots, the measured probability density (green) is very different from the true probability density.
Let us now illustrate with an example
To observe how perceived information is affected by noise, we will use this dataset described here. To follow along, download the notebook and the dataset. We will perturb the traces with different amounts of noise analyse the effect of noise on the perceived information. The no noise scenario represents the original traces. To create the noisy traces, we add white noise (to each sample we add a random value generated from a normal distribution with zero mean and a given standard deviation).
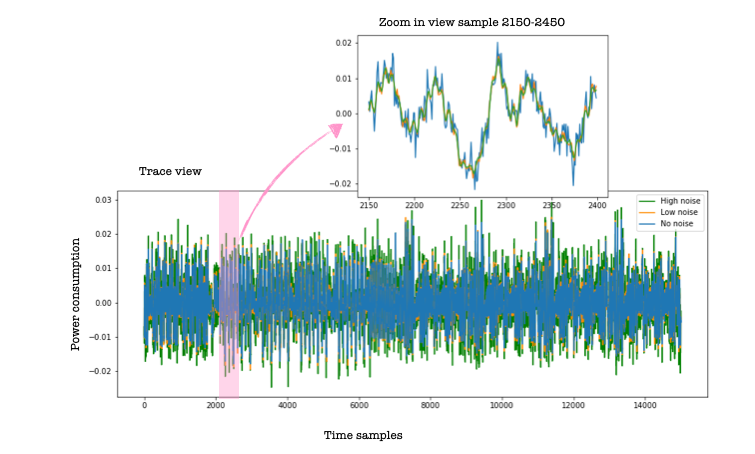
The script for simulating noise can be found here. The figure below shows the effect of a small amount of noise on the traces (orange) and the impact of more significant noise (green).
Although the effect of noise on the raw power traces might not seem significant, the SNR plots for the three cases (no noise, low noise and high noise) shown below show a significant effect. The SNR plots are obtained for the ID leakage model.
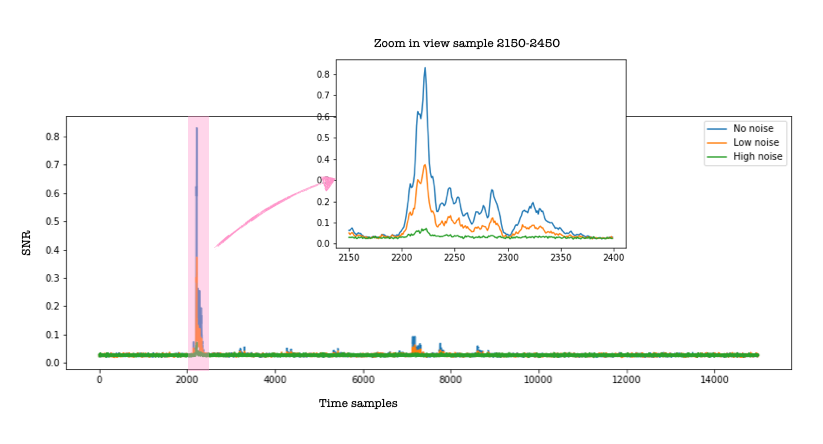
After ~70h, I obtained the hypothetical information value for all 15k samples in the 10k trace set, ID leakage model (one byte). After that, I decided to focus on a small set of samples (2150-2450), containing sample 2222, where the value of the hypothetical information reaches its maximum value. Information-theoretic metrics are quantitative measures; the higher the value, the more information is leaked
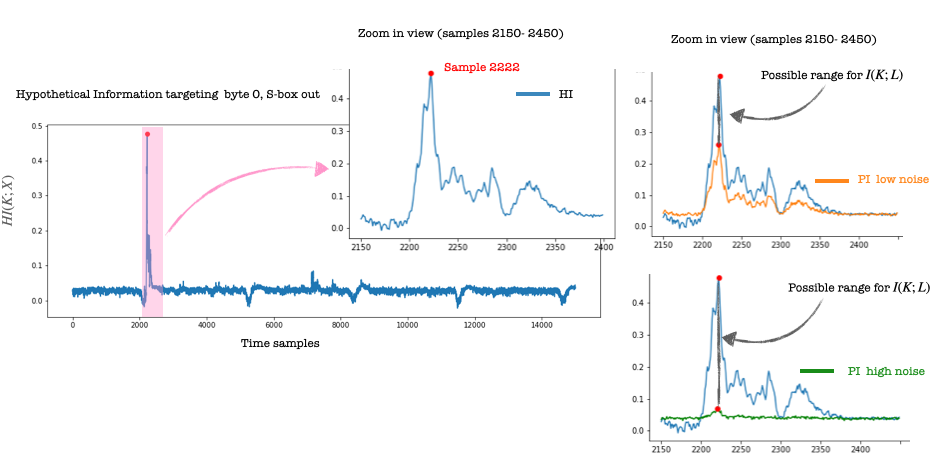
And now the figures we have been waiting for.. the orange line shows the values for the perceived information computed for the low noise scenario. We see a difference compared to the blue line for hypothetical information. For reference, I marked with a red dot the position of sample 2222. Somewhere between the two curves lies the mutual information.
But what happens if we add more noise? The green line shows the perceived information value for the high noise scenario. Again, watch the red dot which marks the position of sample 2222. We see that interval for the possible values for mutual information is more prominent, and our estimation is less precise.
I am surprised by how close the SNR curves are to the PI curves (to the point that I checked if I did not make a mistake in the plots). SNR is so much faster to compute. Also, notice that the PI values for samples (samples 2150-2200), go a little above the HI values (blue line), which should not happen and for which I do not have an explanation (yet!). Please do let me know if you obtain different results or have an explanation for the similarity of SNR and PI.
Acknowledgements:
I would like to thank Lukasz Chmielewski and Eloi Sanfelix for the useful comments in improving this post.
Further reading materials:
-
A formal study of power variability issues and side-channel attacks for nanoscale devices. Mathieu Renauld, Francois-Xavier Standaert, Nicolas Veyrat-Charvillon, Dina Kamel, and Denis Flandre, EUROCRYPT 2011, Link here, is the paper which introduces the concept of perceived information.
-
Leakage Certification Revisited: Bounding Model Errors in Side-Channel Security Evaluations, CRYPTO, 2019, Olivier Bronchain, Julien M. Hendrick, Clement Massart, Alex Olshevsky, Francois-Xavier Standaert.
Link here, introduces the concept of hypothetical information as an upper bound for mutual information and the idea of using perceived information as a lower bound.